
The temptation is to reduce the current situation to one decision:
Buy oil, or stay out.
That is the wrong starting point.
There is no single “Hormuz trade.” An investor buying an oil producer, a crude-oil ETF, a tanker company or an options position may appear to be making the same geopolitical bet, but the risks are very different.
The more useful question is:
Which Hormuz scenario is currently priced into the market, and what would have to happen for that price to be wrong?
The situation in five lines
- Physical conditions have deteriorated faster than the oil price has risen: six reported transits, no LNG movement, a severe maritime threat level and war-risk premiums near 3%-against Brent at only ~$79.
- The core tension: a physical system growing more dangerous versus a fundamental market that returns to oversupply the moment the danger passes.
- Working scenarios: rapid de-escalation 25% ($65-75), managed confrontation 40% ($75-95), prolonged selective disruption 25% ($95-125), regional energy shock 10% ($125-160+).
- The structural difference from every previous crisis: the world's spare capacity sits inside the Gulf, behind the chokepoint, and Qatari LNG has no bypass at all.
- The single strongest signal: physical flow, insurance costs, market structure and diplomacy all moving in the same direction. Any one of them alone can mislead.
Where the market stands
The physical situation deteriorated sharply over the weekend.
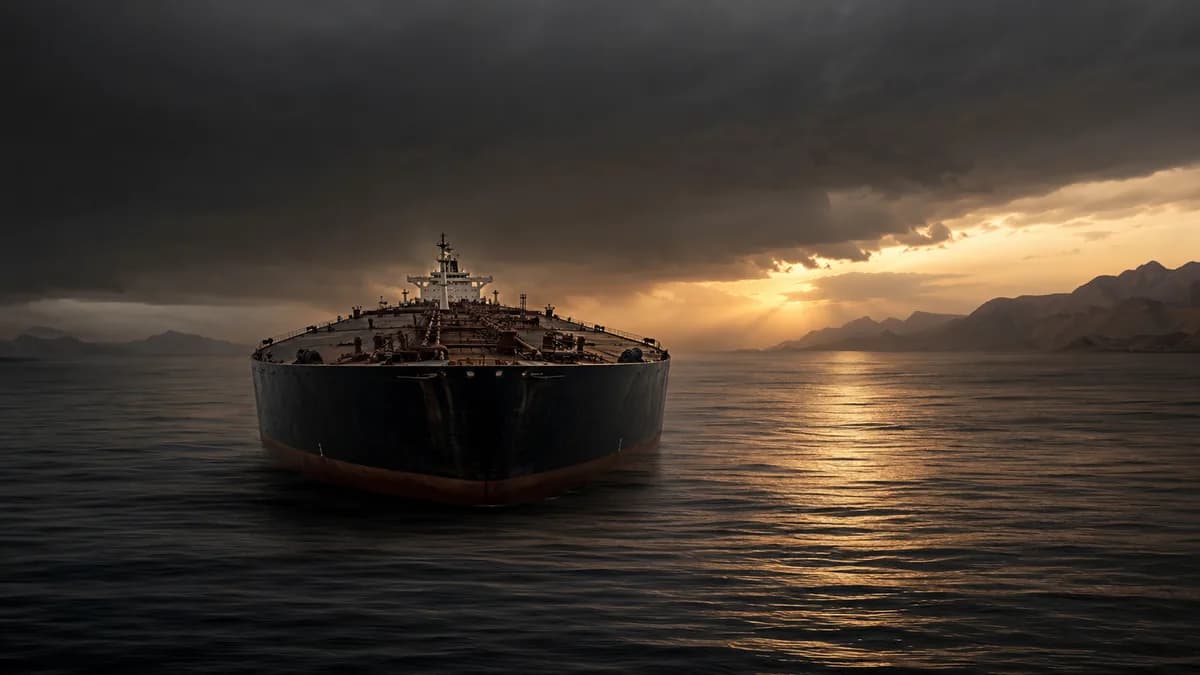
Only six vessels reportedly transited the Strait of Hormuz on Sunday, the lowest number in five weeks. No LNG tankers were detected, while several vessels switched off their tracking signals in the high-risk area. Renewed US strikes on Iranian targets and Iranian attacks on ships have once again made a normal commercial transit difficult to distinguish from a military operation.
The Joint Maritime Information Center currently classifies the threat level in the strait as severe, meaning deliberate hostile action is considered likely under present conditions. US naval authorities maintain that a southern route remains open, despite Iranian claims that the strait has been closed or placed under Iranian control.
The insurance market is reacting as well. War-risk premiums for vessels operating inside the Gulf have moved back towards around 3% of a ship's value, compared with about 2% at the end of the previous week. Because this cover is often repriced every 24 to 48 hours, the numbers escalate quickly. For a very large crude carrier with an insured hull value of around $100 million, a 3% war-risk premium means roughly $3 million in additional insurance cost for a single Gulf voyage, on top of normal freight. At 2 million barrels per cargo, that is roughly $1.50 per barrel in insurance alone, before any risk premium demanded by owners and crews. A one-percentage-point move in the premium therefore changes the economics of every voyage overnight, and when underwriters withdraw cover entirely, the calculation stops mattering: the ship simply does not sail.
Brent responded by rising above $79 per barrel, roughly 4% higher during Monday trading. The dollar also strengthened as markets began pricing a renewed inflation risk.
Those facts appear bullish.
But they are only one half of the investment picture.
Two oil markets are competing with each other
Investors are effectively choosing between two different versions of the future.
The physical-risk market
In this market:
- Tanker traffic is collapsing.
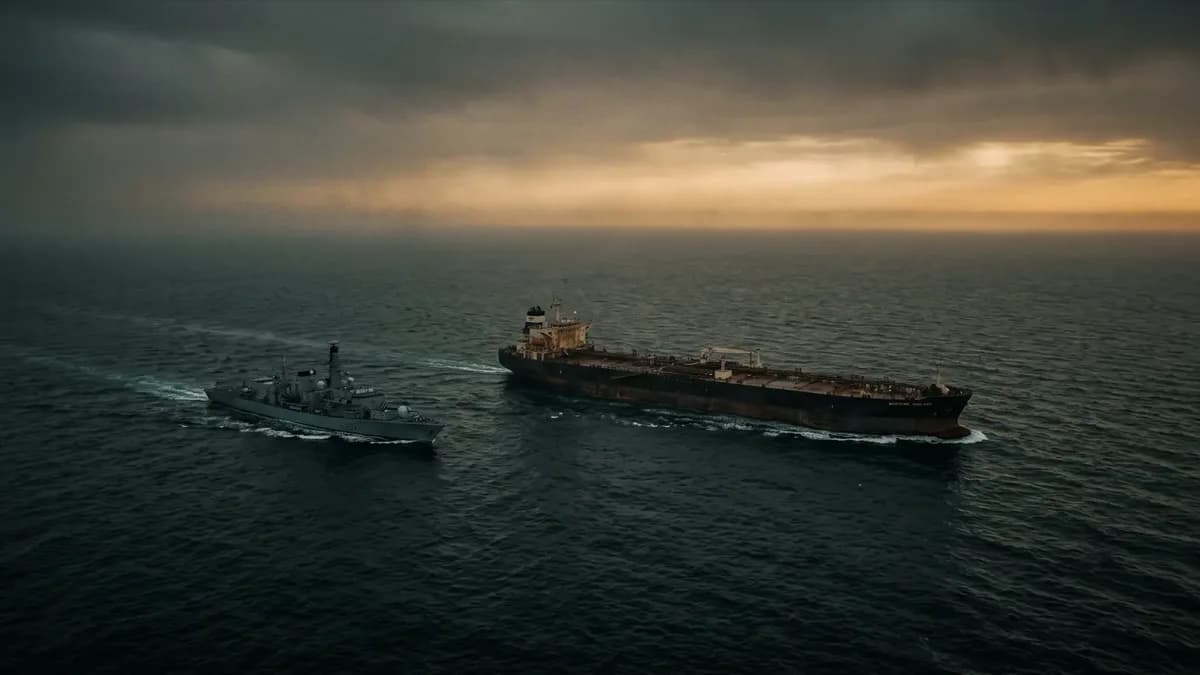
- Commercial vessels require military protection.
- War-risk insurance remains extraordinarily expensive.
- LNG transit has been interrupted.
- Energy infrastructure can be targeted by relatively inexpensive missiles and drones.
- Diplomatic agreements can unravel within hours.
This market says that oil near $79 may not fully reflect the risk of a prolonged disruption.
The fundamental oil market
In the other market:
- Gulf production and exports recovered substantially during June.
- Non-Gulf producers increased supply.
- High prices reduced consumption.
- Strategic reserves and commercial inventories absorbed part of the shock.
- A slower global economy weakened underlying demand.
- A normalisation of Hormuz traffic could return the market to oversupply.
The International Energy Agency estimated that global supply rebounded by 4.1 million barrels per day in June, although production remained around 9.4 million barrels per day below pre-war levels. Crucially, the IEA's recovery outlook remains dependent on renewed de-escalation.
The US Energy Information Administration's July baseline, prepared before the latest weekend escalation, forecast Brent averaging $74 in the third quarter and $70 in the fourth quarter. That forecast assumes improving trade flows and the gradual return of production.
The market therefore sits between a physical system that is becoming more dangerous and a fundamental system that could become oversupplied if the danger passes.
That tension explains why neither buying nor avoiding oil is an obvious decision.
The five variables that matter most
1. How many barrels are actually being lost?
Ship counts attract headlines, but barrels matter more.
Six small or empty vessels are not equivalent to six fully loaded supertankers. At the same time, vessels operating without reliable AIS signals mean public traffic data can understate actual flows.
Investors should therefore separate:
- Total vessel transits
- Loaded tanker transits
- Estimated barrels exported
- Empty tankers entering the Gulf
- LNG and LPG movements
- Vessels operating with tracking disabled
A falling ship count measures confidence and operational risk. Falling barrel volumes create the direct supply shock.
The two can move differently.
2. How long does the disruption last?
Duration is more important than the initial headline.
A two-day interruption can be absorbed through storage, delayed deliveries and alternative cargoes. A four-week interruption forces refiners to compete for replacement barrels, drains inventories and creates shortages in specific crude grades and refined products.
The price response is therefore not linear.
The first days create volatility. The following weeks create physical scarcity.
3. How much can the system absorb, and where does absorption fail?
The Strait normally carries some 20 million barrels per day of crude oil, condensate and petroleum products, around one-fifth of global petroleum consumption and roughly one-quarter of seaborne oil trade.
Existing Saudi and UAE pipelines can bypass part of the strait, but not enough to replace normal Hormuz traffic. Saudi Arabia is considering a substantial future expansion of its East-West pipeline, but that would be a multi-year infrastructure project rather than a solution to the present crisis.
The spare-capacity paradox
In almost every previous oil crisis, the market's ultimate safety net has been OPEC spare capacity, production that can be switched on within weeks to replace lost barrels.
A Hormuz crisis breaks that mechanism.
The overwhelming majority of the world's usable spare capacity is held by Saudi Arabia and the United Arab Emirates. Nearly all of it sits inside the Gulf, behind the same chokepoint that is now under threat. Saudi Arabia can, in theory, produce millions of additional barrels per day. But if those barrels cannot be insured, loaded and shipped through Hormuz, they exist on paper rather than in the market.
The bypass routes change this only partially. The Saudi East-West pipeline to the Red Sea has a nameplate capacity of roughly 5 million barrels per day, part of which is already in regular use. The UAE's ADCOP pipeline to Fujairah, on the Gulf of Oman, can carry between 1.5 and 1.8 million barrels per day. Together, realistically, some 4 to 5 million barrels per day can avoid the strait, against a normal Hormuz flow of around 20 million.
The remaining spare capacity outside the Gulf, scattered across a handful of producers, is modest by comparison and cannot scale quickly.
This is the structural feature that distinguishes Hormuz from every other supply disruption: the shock absorber is locked inside the room where the shock is happening. In a Libyan outage or a Venezuelan collapse, Gulf producers ride to the rescue. In a Hormuz closure, the rescuers are trapped too.
For investors, the implication is direct. The scenarios in which spare capacity would matter most are precisely the scenarios in which it is least available. Standard mental models-“OPEC will fill the gap”-do not apply here, and any analysis that leans on headline spare-capacity figures without asking where that capacity sits is measuring the wrong thing.
LNG: the flow with no plan B
The oil discussion at least has partial answers, pipelines, reserves, rerouting. Liquefied natural gas has none.
Qatar supplies roughly 20% of the world's LNG, and every cargo leaves through the Strait of Hormuz. There is no pipeline alternative, no overland bypass and no meaningful strategic LNG reserve anywhere in the importing world. Gas storage exists, but it is measured in weeks of buffer, not months of replacement.
That makes the current absence of LNG transits through the strait more significant than the falling tanker count. Crude cargoes can be delayed, redirected or substituted from storage; a missing LNG cargo is simply missing.
The exposure map is also different from oil. Qatari LNG flows overwhelmingly to Asia, but the moment those cargoes stop, Asian buyers turn to the Atlantic spot market and start competing directly with Europe for American and other flexible supply. Europe imports barely any energy through Hormuz directly, yet a prolonged interruption would still reach European gas bills within weeks. The 2022 energy crisis demonstrated the mechanism: LNG is a single global market connected by price, and a shortage anywhere becomes a price shock everywhere.
A prolonged Hormuz disruption is therefore not only an oil event. It is a combined oil-and-gas event in which the gas component has fewer buffers, fewer workarounds and a more direct line to consumer energy prices. Investors watching only Brent are watching half the screen: European TTF and Asian JKM gas prices belong on the same dashboard.
Emergency reserves: a buffer, not a substitute
Emergency reserves provide another buffer. IEA members entered the crisis with more than 1.2 billion barrels in government-controlled emergency stocks, plus a further 600 million barrels or so held by industry under government obligations. However, strategic reserves can buy time; they cannot permanently replace a major export corridor.
The longer the disruption continues, the less comforting the reserve headline becomes.
4. Does the oil shock damage demand?
Higher oil prices are not automatically bullish indefinitely.
It also matters wherethe pain lands. Roughly 80% of the crude passing through Hormuz is destined for Asia, China, India, Japan and South Korea are the dominant buyers. A Hormuz disruption is therefore first and foremost an Asian supply shock. The politics of strategic-reserve releases, the competition for replacement barrels and the demand-destruction dynamics will play out primarily in Asian markets, even while the price signal appears on European and American screens. China's response, releasing its own substantial reserves, leaning on discounted alternative suppliers or bidding aggressively for Atlantic Basin cargoes, may shape the price path more than any Western policy decision.
At first, a supply disruption pushes prices higher. But expensive fuel eventually reduces transport activity, squeezes consumers, damages industrial margins and slows economic growth.
The dollar may strengthen. Inflation expectations may rise. Central banks may become less willing to cut interest rates, or may even tighten policy. That can place pressure on equities, emerging markets and economically sensitive commodities. The latest escalation is already reviving those inflation and monetary-policy concerns.
At some point, the oil shock begins destroying the demand required to sustain the oil rally.
This is why oil can fall while the geopolitical situation remains dangerous.
5. Is the market trading barrels or headlines?
In the short term, positioning matters.
A market crowded with speculative long positions can fall on merely “less bad” news. A market that has removed most of its geopolitical premium can rise violently when physical conditions deteriorate.
Investors should therefore watch the futures curve, not only the spot price.
Strong backwardation, where prompt oil trades above later deliveries, usually indicates that buyers value immediate supply. Widening prompt spreads can reveal physical tightness before it becomes fully visible in the headline Brent price. For how that split is showing up between crude and refined products, see the split oil market.
A flat or weakening curve during dramatic news may indicate that the market expects the disruption to be temporary.
For where that premium stood before the latest escalation, see our earlier analysis Priced for Peace.
What history says about pricing fear
Three precedents should discipline any Hormuz position.
Abqaiq, September 2019: the premium that vanished
The drone and missile attack on Saudi Arabia's Abqaiq processing facility and the Khurais field knocked out some 5.7 million barrels per day, the largest single supply disruption in the history of the oil market, larger than the 1973 embargo or the Iranian revolution in absolute terms.
Brent recorded its biggest intraday percentage jump in decades.
Then Saudi Arabia restored production faster than almost anyone predicted, and within roughly two weeks the entire geopolitical premium had evaporated. Traders who bought the headline at the peak were underwater before the month ended, despite being entirely correct that something historic had happened.
Abqaiq is the clearest warning for Scenario 1 buyers: the market punishes those who confuse the size of an event with the duration of its price effect.
The Tanker War, 1984-1988: dangerous but open
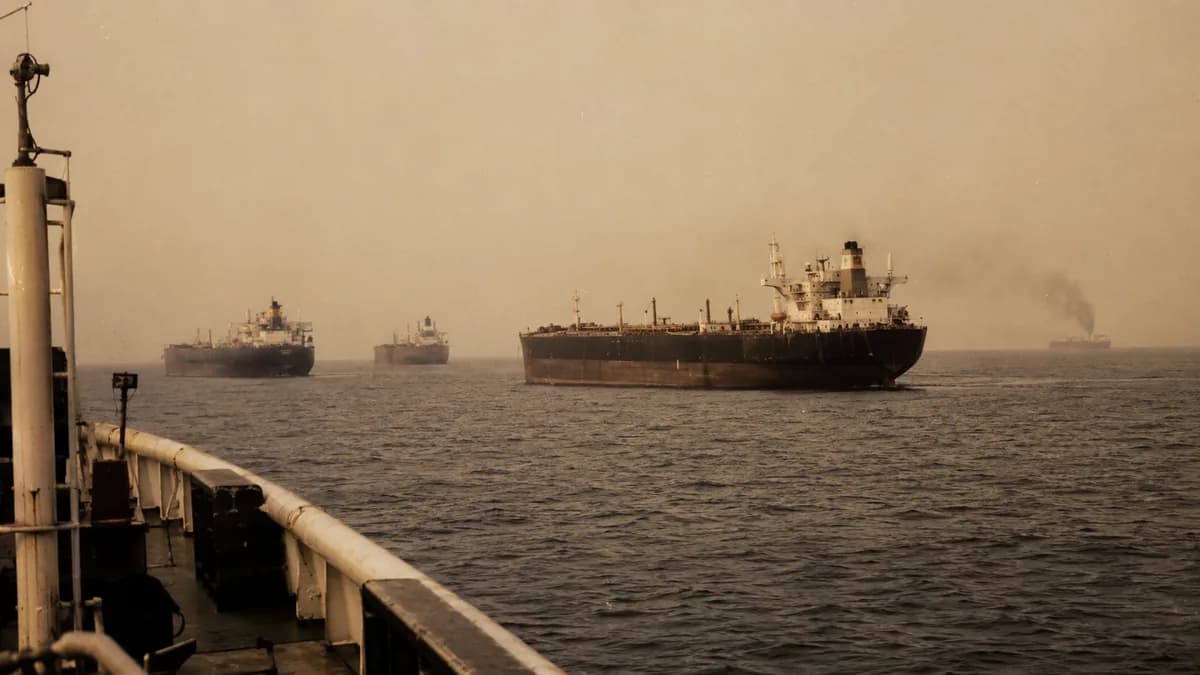
During the Iran-Iraq war, hundreds of commercial vessels were attacked in the Gulf. Ships burned, crews died, insurance costs soared and the US Navy ended up escorting reflagged tankers.
And yet Hormuz never closed. Oil kept flowing throughout, and prices, weighed down by abundant supply elsewhere, spent much of the period falling.
The Tanker War is the historical case for today's 40% scenario: a strait that is violent, expensive and militarised, but commercially functional. It demonstrates that “attacks on shipping” and “supply crisis” are not the same thing, and that the market can live with a remarkable level of ambient violence once it becomes routine.
Russia, 2022: the disruption that was priced but never came
After the invasion of Ukraine, the market priced in the loss of a large share of Russian exports. Brent touched $139.
The barrels largely kept flowing, rerouted, discounted and reflagged, but flowing. Within a year, Brent traded below $80.
The lesson is not that sanctions or conflicts do not matter. It is that the oil market is more adaptive than crisis-moment analysis assumes, and that positions built on the maximum-disruption scenario carry a specific risk: the world finding a workaround.
What the precedents do, and do not, cover
None of these cases involved a genuine, sustained closure of Hormuz itself. Abqaiq was a production shock with intact export routes. The Tanker War never stopped transit. Russia had alternative buyers and alternative routes.
A prolonged Hormuz closure has no historical precedentwhich is exactly why Scenario 4 carries both a low probability and an extreme price range. History teaches investors to fade the first headline; it offers no guidance for the one event that has never happened.
Four scenarios from here
The following are HormuzEye working scenarios, not precise forecasts. The probability weights and price ranges are intended to show the distribution of possible outcomes rather than predict one closing price.
| Scenario | Working weight | What happens | Illustrative Brent environment |
|---|---|---|---|
| Rapid de-escalation | 25% | Strikes stop, diplomacy resumes, insurance falls and commercial transit recovers | $65-$75 |
| Managed confrontation | 40% | Intermittent attacks continue, but some escorted and approved traffic moves | $75-$95 |
| Prolonged selective disruption | 25% | Iran restricts particular vessels, insurers withdraw and Gulf exports remain materially reduced | $95-$125 |
| Regional energy shock | 10% | Major infrastructure is damaged or the strait becomes effectively impassable for an extended period | $125-$160+, with possible temporary overshoots |
These bands should not be read as mechanical targets. Oil can trade outside them, and the path may be more important than the final level.
Scenario 1: Rapid de-escalation
This is the bearish oil scenario.
Washington and Tehran reopen a diplomatic channel, both sides pause further strikes, and the southern shipping route begins operating without frequent incidents. Tanker owners return, war-risk premiums fall and previously delayed cargoes enter the market.
In that environment, the geopolitical premium could disappear rapidly.
The EIA's fundamental outlook, Brent moving towards $70 later in the year, would become relevant again. Rising supply and weak demand would regain control of the price.
The danger for late buyers is clear: they may buy the most dramatic headline immediately before the risk premium unwinds.
Scenario 2: Managed confrontation
This is presently the most plausible middle path.
The strait is neither fully open nor completely closed. Iran continues imposing restrictions or threatening unauthorised vessels. US forces maintain a southern transit route. Some ships move under escort or political coordination, while others wait outside the region.
Oil remains volatile, but enough barrels move to prevent a catastrophic shortage.
In this environment, Brent can remain supported in a broad range while reacting sharply to individual attacks, diplomatic announcements and shipping reports.
It is also the environment most likely to punish excessive leverage. Prices can move several dollars in either direction without the underlying scenario genuinely changing.
Scenario 3: Prolonged selective disruption
This scenario does not require Iran to physically block every vessel.
A de facto closure can occur when:
- Insurers refuse to provide cover.
- Crews decline assignments.
- Charterers cancel voyages.
- Ports and terminals cannot operate safely.
- Only politically approved ships receive passage.
- GPS interference makes navigation unreliable.
- Naval escorts cannot support normal commercial volumes.
The important distinction is between a legally open waterway and a commercially usable one.
Under this scenario, inventories continue falling, refiners compete for alternative crude and buyers pay increasingly large freight and insurance premiums. Triple-digit Brent would become materially more plausible.
Scenario 4: Regional energy shock
This is the low-probability, high-impact outcome.
A major oil terminal, refinery, processing facility, pipeline or loading port is damaged. Attacks spread across several Gulf states. The southern passage becomes unsafe, while northern transit remains restricted.
This scenario cannot be solved through a single emergency stock release. It would create a combined oil, products, LNG, freight and inflation shock.
The result would not simply be “higher oil.” It could mean weaker global equities, higher inflation expectations, disrupted industrial supply chains and pressure on energy-importing economies.
Cheap drones have made large, fixed energy assets increasingly vulnerable, while defending every terminal, pipeline and processing facility is both difficult and expensive.
For the latest July update to this scenario map, the ceasefire ended on 8 July and the US blockade returned, see Ceasefire Dead, Blockade Back. For weekend traffic and SPR drawdowns since then, see the Hormuz Update of 11 August. For the live picture, see the Strait of Hormuz status page. Before chasing the next candle, read Should You Trade the Oil Spike?.
What exactly are investors buying?
Investors should be careful with the phrase “investing in oil.”
Different instruments produce different outcomes.
Crude-oil futures and exchange-traded products
These provide relatively direct exposure to oil prices but introduce futures-curve, rollover and volatility risks. They can react immediately to geopolitical news and can also reverse immediately when tensions ease.
Upstream oil producers
Producers outside the disrupted region may benefit from higher realised prices without facing the same direct export risk.
But company returns still depend on production costs, hedging, taxation, debt, capital discipline and operational performance. A correct oil forecast does not guarantee a profitable equity investment.
Integrated oil majors
Large integrated companies combine upstream production, refining, trading and distribution. Higher crude prices can help one division while squeezing another.
Their diversification can reduce sensitivity to a single price move, but it also makes the investment less equivalent to a pure oil position.
Tanker companies
Higher freight rates can benefit shipowners, but complete route disruption can reduce the number of voyages available. War-risk premiums, crew safety, vessel availability and charter arrangements all matter.
Tanker equities are therefore not a simple leveraged oil trade.
Refiners
Refiners care about the difference between the cost of crude and the price of refined products.
A crude-price increase can hurt margins unless gasoline, diesel and jet-fuel prices rise faster. Access to the correct crude grade and shipping route may matter more than the absolute Brent price.
Airlines, chemicals and transport companies
For these businesses, higher energy prices generally represent a cost shock. Hedging can delay the impact but rarely removes it permanently.
Investors buying energy as a hedge should examine whether they already hold significant indirect exposure to higher oil elsewhere in their portfolios.
A decision framework, not a trading signal
The choice should begin with four questions.
What is the time horizon?
A three-day geopolitical trade is fundamentally different from a five-year investment in an energy company.
Short-term positions depend heavily on shipping reports, military statements and weekend event risk. Long-term investments depend more on asset quality, costs, balance sheets and management.
What scenario is required for the investment to work?
A position that only profits under full regional escalation is not a normal energy investment. It is a tail-risk position.
Investors should state their required scenario explicitly before committing capital.
How much of the move has already occurred?
Being correct about the direction of an event does not guarantee a profitable entry price.
The market can price a disruption before physical shortages appear. It can also remove the premium before political risk disappears.
What is the maximum acceptable loss?
Geopolitical markets gap.
Stop-loss orders cannot guarantee execution at the expected price when markets reopen sharply higher or lower. Leveraged positions can therefore lose considerably more quickly than investors anticipate.
For many participants, staged exposure or structures with a predefined maximum loss may be more appropriate than a binary, highly leveraged position.
The HormuzEye dashboard: what to monitor every day
Ignore broad declarations that the strait is simply “open” or “closed.” Watch the operational evidence.
| Indicator | Improving signal | Deteriorating signal |
|---|---|---|
| Physical flow | ||
| Seven-day tanker flow | Loaded transits rise consistently | New multi-week lows |
| LNG movements | Regular Qatari cargoes resume | No LNG transit |
| Vessel behaviour | Normal AIS use and independent passage | Dark transits, GPS interference and escorts |
| Inventories | Drawdowns slow | Accelerating stock depletion |
| Market structure | ||
| Brent futures curve | Prompt spreads weaken | Backwardation widens sharply |
| Brent-Dubai EFS | Spread normalises | Dubai weakens sharply versus Brent as Gulf grades are shunned |
| Options skew | Call skew flattens, implied volatility falls | 25-delta calls trade at a rising premium to puts |
| Managed money positioning | Speculative length is reduced in an orderly way | Crowded longs build on top of an already-priced premium |
| Cost of risk | ||
| War-risk insurance | Premiums fall towards normal levels | Underwriters raise rates or withdraw |
| VLCC freight (TD3C) | Gulf-Asia rates ease | Rates spike as owners demand danger premiums |
| Gas prices (TTF / JKM) | Stable despite headlines | Sustained repricing on LNG interruption |
| Politics & security | ||
| Military activity | Multi-day pause in strikes | Attacks on ships or energy infrastructure |
| Diplomacy | Verifiable operational agreement | Competing closure and control claims |

A few of these deserve explanation.
The Brent-Dubai spread matters because Dubai reflects the price of Gulf-origin crude specifically. If refiners begin avoiding barrels that must transit Hormuz, Dubai-linked grades weaken relative to Brent before the headline price tells the story.
Options skew measures what the market pays for protection against a price spike. When 25-delta calls trade at a widening premium to puts, professional money is buying insurance against escalation, regardless of what the spot price does.
Positioning data (published weekly by US and European regulators) reveals whether a rally is carried by physical tightness or by speculative length. A market that is both crowded and expensive can fall violently on modestly good news; a market that has flushed its longs can rise violently on modestly bad news.
TD3C-the benchmark VLCC freight route from the Gulf to China, is the daily market price of Hormuz risk as assessed by the people who actually have to sail through it.
No individual indicator is sufficient. A diplomatic statement without improving shipping is weak evidence. Rising vessel traffic without falling insurance costs may be temporary. Falling Brent while inventories continue declining may indicate complacency rather than normalisation.
The strongest signal comes when physical flow, market structure, the cost of risk and diplomacy all move in the same direction.
So: buy now or wait?
There is no universal answer.
The present situation offers genuine upside risk because physical shipping conditions have deteriorated faster than the oil price has increased. Six reported transits, the absence of LNG movements and a severe maritime threat assessment do not describe a normalised energy corridor.
But buying after a weekend escalation also means paying a renewed geopolitical premium while diplomacy remains possible and the fundamental oil market may return to oversupply.
That creates an asymmetric but two-sided market:
- De-escalation can remove several dollars of risk premium rapidly.
- Prolonged disruption can create a much larger upward move.
- The middle scenario can produce violent fluctuations without a lasting trend.
The rational response is not certainty.
It is scenario discipline.
Investors should know which future they are buying, what evidence would confirm it, what evidence would invalidate it and how much they can lose if the market chooses a different path.
Hormuz is dangerous. That alone does not make every energy investment attractive.
The investment opportunity exists only where the market price underestimates the probability or consequences of the scenario that actually follows.
That is the difference between reacting to Hormuz, and analysing it.
HormuzEye provides independent, educational market analysis. This article does not constitute investment advice, a recommendation or an invitation to buy or sell any financial instrument. Energy and derivatives markets are volatile and can result in substantial losses.