Priced for Peace: What $73 Brent Gets Wrong About Hormuz
Brent just posted its worst quarter since 2020 while the Strait of Hormuz runs at a fraction of pre-war traffic. We break down the gap between price and physics — and stress-test it in the HormuzEye Risk Monitor.

Brent crude closed out the second quarter of 2026 with its steepest quarterly decline since 2020 — down more than 23% — and now trades in the low $70s. Futures desks are talking about a supply glut. JPMorgan cut its year-end Brent forecast to $64. Morgan Stanley trimmed to $75. Iran says it has shipped more than 40 million barrels since the US naval blockade was lifted, and Russian exports are running at record levels.
Read the tape, and the Hormuz crisis is over.
Now read the water. On June 29, total transits through the Strait of Hormuz came to 42 vessels — roughly 70% below the pre-war baseline of 130–138 per day. Traffic is split between two corridors: a northern route coordinated by Iran, and a southern route near Oman that runs under US military escort, where usage remains suppressed after a strike on June 25. That same weekend, a drone hit the Panamanian-flagged tanker Kiku carrying more than 2 million barrels of crude, and US Central Command answered by striking ten Iranian military targets in and around the strait. War-risk insurance remains a multiple of normal levels. Mine concerns have not been formally resolved.
One of these two pictures is mispriced. This piece walks through which one — and then puts numbers on it using our new Hormuz Risk Monitor.
The reopening that isn't quite a reopening
The June 17 memorandum of understanding between Washington and Tehran did three things: it paused hostilities, lifted the US naval blockade, and reopened the strait to commercial traffic — nominally toll-free for a 60-day negotiating window.
What it did not do is restore the pre-war status quo. Iran has been explicit, in Doha and in public, that it intends to keep overseeing traffic through the strait. The Revolutionary Guards have published maps of "approved" inbound and outbound routes. Vessels taking the southern corridor without coordination have been fired on. And the question of what happens after day 60 — specifically whether Iran can levy transit or "service" fees, Suez-style — is the single largest open item in the talks. The US, Europe and the Gulf states have rejected fees categorically. Iran has not withdrawn the demand.
So the honest description of Hormuz today is not "open" or "closed." It is contested: a chokepoint operating under a fragile interim arrangement, with two parallel traffic systems, active military escorts, and a hard deadline in mid-August.
The data problem nobody talks about
Here is where it gets interesting for anyone trying to trade this: the traffic numbers don't agree with each other.
- Kpler ship-tracking data (via Bloomberg) counted 24 commodity vessels transiting on Monday June 29 — framed as roughly 90% below the 130+ daily pre-war count.
- Maritime intelligence firm Windward logged 42 total transits the same day (23 inbound, 19 outbound), including 10 confirmed "dark" transits — vessels running without honest AIS broadcasts.
- Bloomberg, meanwhile, reports that oil flow through the strait has recovered to more than 10 million barrels per day, against roughly 20 million pre-war — with another ~5 million moving via alternative routes and pipelines.
These are not contradictions; they are three different measurements of a distorted system. Three things explain the gap:
1. Barrels are recovering faster than hulls. Fewer ships are transiting, but they skew larger. VLCCs entering the Gulf in ballast on optimism, loading full, and running the gauntlet once — instead of the pre-war rhythm of continuous mixed traffic.
2. Dark transits corrupt the count. Windward's 10 confirmed dark transits in a single day means any AIS-based count is a floor, not a measurement. GPS jamming across the Gulf makes it worse. Recent days also produced two OFAC-sanctioned vessels caught falsely broadcasting Norwegian registry — Iranian-linked tonnage borrowing a NATO member's flag to lower interdiction risk.
3. The corridors have different observability. Northern-route transits coordinated with Iran and southern-route convoys under US air cover behave differently, report differently, and recover at different speeds.
The practical takeaway: when a headline says traffic is "down 90%" and another says flows are "more than half recovered," both can be true. Ship counts measure risk appetite. Barrel counts measure supply. Right now, supply is healing faster than confidence — which is precisely why the price has collapsed while insurance hasn't.
What the market is pricing — and what it's ignoring
The bear case currently in the price is straightforward: barrels are moving, Iranian and Russian exports are surging, inventories at sea are building, and the Doha talks are progressing. On that view, the residual war premium in Brent is close to zero, and the next move is down toward the high $60s.
The complacency case is what ING's commodity team flagged after the Kiku strike: the market is "shrugging off" live military exchanges in the world's most important oil chokepoint, leaving "significant upside risk if the supply recovery proves slow — or if we see significant re-escalation."
Three specific things are, in our view, under-priced at $73:
1. The day-60 cliff. The no-fee arrangement expires in mid-August. Iran's fee demand is not a bargaining chip it has quietly dropped — it is the core of Tehran's post-war position that its leverage over the strait is the one asset the war created. A breakdown over fees doesn't require a return to full blockade to move price; a single week of northern-corridor "inspections" would do it.
2. Escort dependence. A meaningful share of southern-corridor traffic currently moves under US air cover. That is not a normalized shipping market; it is a military operation with a commercial output. Escort posture can change with one policy decision in Washington.
3. The insurance floor. War-risk premiums remain far above normal. Underwriters are pricing the same strait the futures market says is fixed. Historically, when insurance and futures disagree about a chokepoint, insurance has the better track record.
Running it through the Risk Monitor
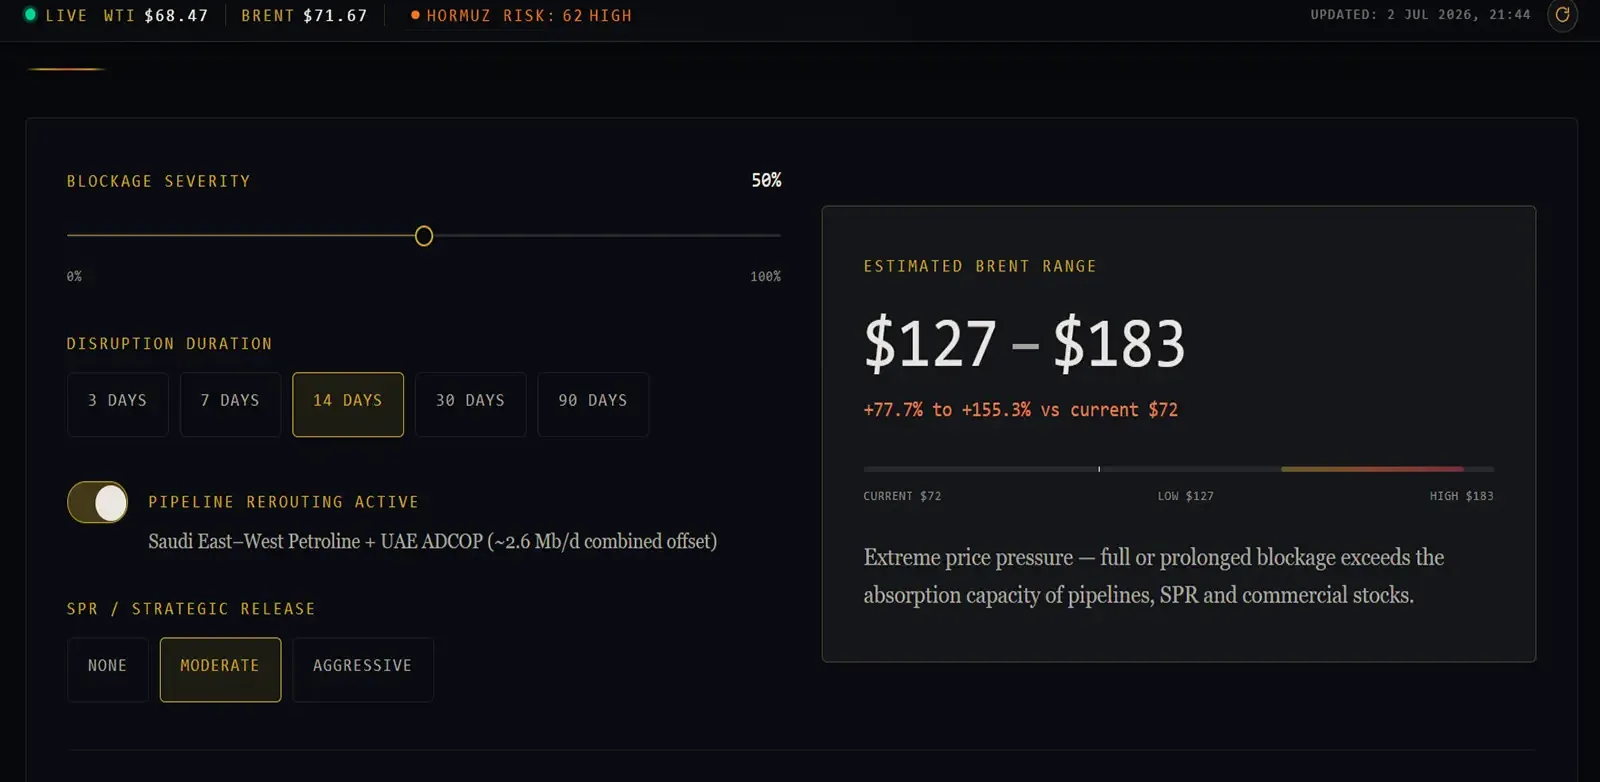
This is exactly the kind of question we built the Hormuz Risk Monitor & Scenario Simulator to answer: not "what happened," but "what is a given scenario worth in dollars per barrel?"
Set the simulator to today's effective conditions — low blockage severity, short duration, pipeline rerouting active (the Saudi East-West and UAE Fujairah lines are absorbing roughly 2.6 Mb/d), no SPR release — and the model output lands almost exactly where spot Brent trades: low $70s, negligible premium. The market and the model agree that the current state is manageable. Buffers, rerouting and recovering flows really do absorb this level of disruption.
The value is in moving the sliders. Push blockage severity up to reflect a post-day-60 breakdown — Iran enforcing fees, southern corridor closed, duration measured in weeks rather than days — and the model's estimated range shifts materially higher, even with rerouting and SPR options engaged. Toggle the pipelines off (they are, after all, above-ground infrastructure inside missile range) and the output stops looking anything like $73.
That spread — between the model's base case and its stress case — is a reasonable first-order estimate of the optionality the market is currently giving away. The tool is free, transparent about its assumptions, and takes about thirty seconds per scenario. We'd encourage you to disagree with our settings and run your own.
What to watch between now and day 60
- Doha, and specifically the fee question. Everything else in the talks is negotiable; this is the item with a direct price transmission.
- Southern corridor share. Recovery of un-escorted Oman-route transits is the cleanest signal of genuine normalization. Suppressed southern traffic means the strait is functioning on Iranian terms.
- Dark-transit share. A rising share of dark and false-flag transits signals shippers routing around the political system rather than through it — fragile by construction.
- War-risk premiums. Watch for underwriters, not analysts, to declare the crisis over.
- Mid-August. Mark the day-60 expiry in your calendar. The market apparently hasn't.
Hormuz is not closed. But it is not open in any sense a 2025 shipping executive would recognize. At $73, Brent is priced for a peace that has been signed as a memorandum, tested by drones, and scheduled to expire in six weeks. The Risk Monitor will tell you what your own scenario is worth — run it here.
Data referenced: Kpler via Bloomberg, Windward Maritime Intelligence, IMF PortWatch, Trading Economics, EIA STEO. Figures as of July 2, 2026.
Related analysis
Art of the Deal? What America Actually Gained from the Iran War
Three months of war, up to $1 trillion in damage, and a deal that looks weaker than the JCPOA. A sober ledger of what Washington won — and what Tehran took home.
HormuzStrait of Hormuz: Oil Prices & the Iran Conflict (June 2026)
Hormuz is shut, Brent near $96, and the truce is fragile. Analysis of oil prices, the US–Israel–Iran conflict, and the scenarios for June 2026.