
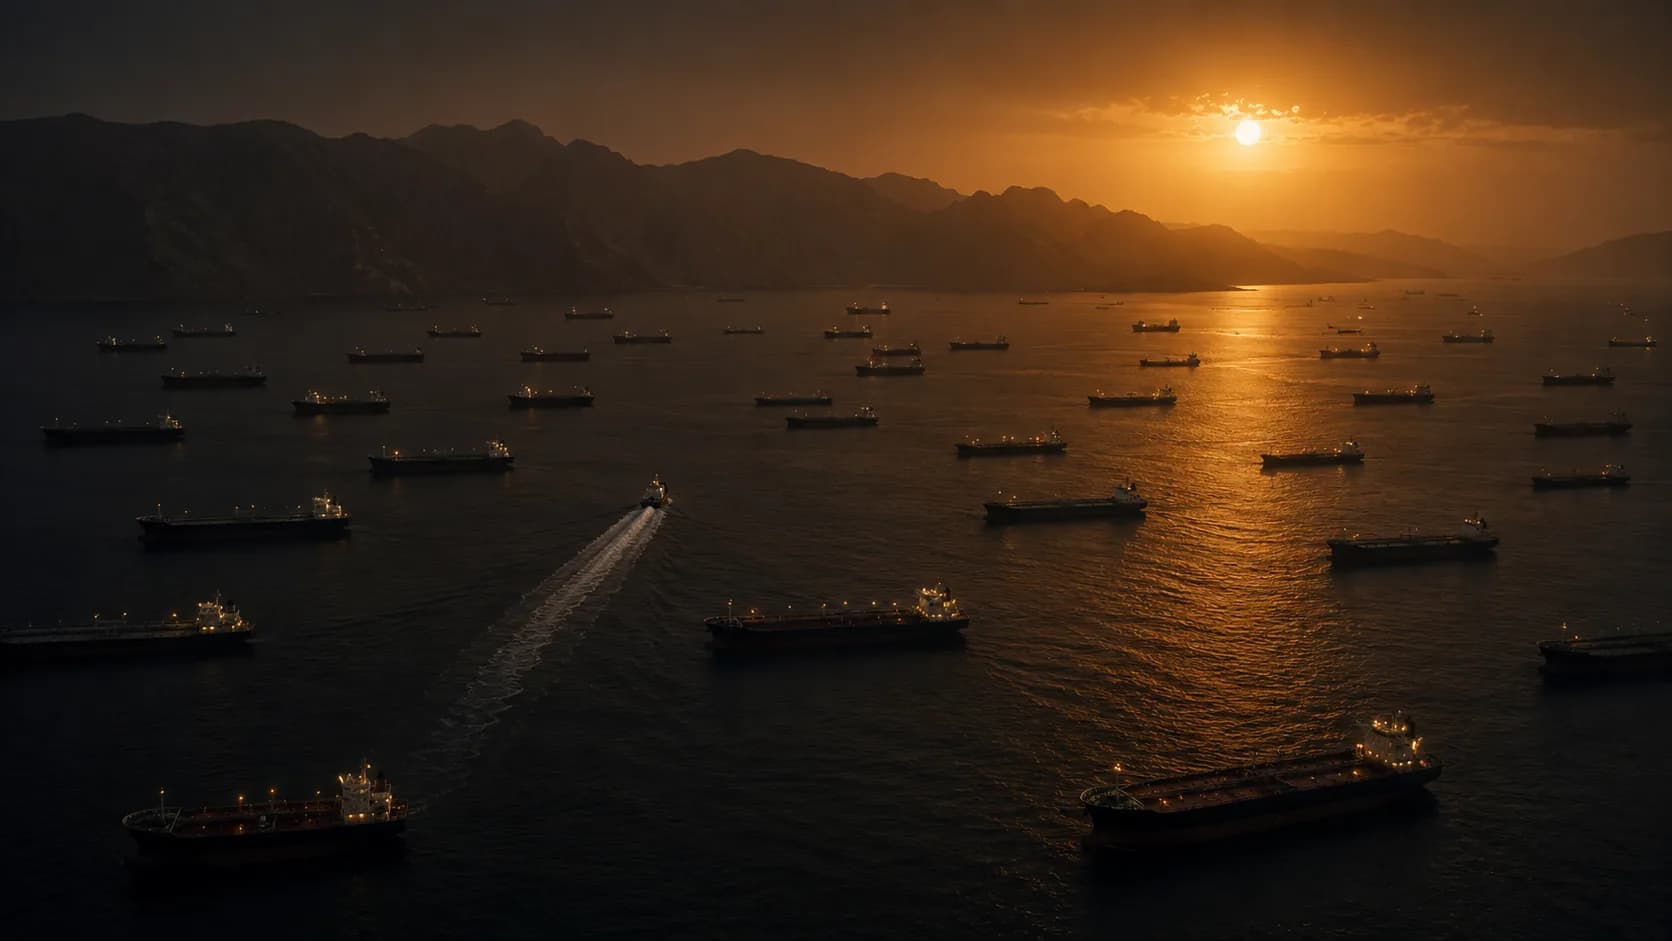
June's fragile calm unravelled in eight days. Since 8 July the ceasefire has been formally declared over, the Strait of Hormuz blockade is back, and tankers have been hit in three attack waves.
HormuzEye raises the Strait of Hormuz risk score from 72 to 84.
Strait of Hormuz status: what changed after July 8
The sequence matters because each step closed an off-ramp that markets had still been pricing as open.
- 7 July, Islamic Revolutionary Guard Corps (IRGC) missiles strike vessels near Hormuz. The Qatari LNG tanker Al Rekayyat and the Saudi tanker Wedyan are hit while peace talks are still underway.
- 8 July, President Trump declares the ceasefire with Tehran over.
- 12 July, A second attack wave; commercial shipping on the Omani (southern) route virtually stops.
- 13 July, Transits fall to 14 ships on Sunday, roughly 60% below a week earlier (Kpler). The US reports more than 8 million barrels that passed under military escort.
- 14 July, Iranian cruise missiles hit two Liberian-flagged VLCCs, very large crude carriers, (Mombasa B, Al Bahyah) in Omani waters, one Indian crew member killed, eight wounded. The same day at 20:00 UTC, Washington reinstates the naval blockade on Iran-linked shipping and scraps the announced 20% transit-toll plan.
The June framework that briefly reopened the corridor is documented in our analysis of the Iran-US 14-point deal.
What changed in the threat profile
The core point for readers is target selection. Mombasa B and Al Bahyah had no US, British or Israeli ownership link, both had been sailing AIS-dark, with tracking transponders switched off, (11 and 7 days respectively).
The IRGC is now hitting non-compliant / dark-running vessels rather than selecting by nationality. That rewrites the risk calculus for every shipowner, not only Western ones.
For how markets were still mapping escalation probabilities before this week, see our Hormuz scenario map for investors.
The numbers
Physical conditions and insurance have moved faster than the futures strip.
- Transit volume: about 10 ships/day around 12 July against an ~88 baseline (IMF PortWatch, large cargo/tankers), 11% of normal.
- War-risk insurance: 8× pre-crisis levels; six P&I clubs, the mutual insurers covering most of the world's tankers, have withdrawn cover.
- Brent: ~$85, strikingly calm given the physical picture; futures still price a diplomatic outcome.

Methodological note: two pre-war baselines circulate, ~88/day (PortWatch, large cargo/tankers only) and 120-140/day (total traffic including smaller vessels). Both are valid; they measure different things. HormuzEye uses the PortWatch baseline for percentages so comparisons stay apples-to-apples.
Headline "down X%" figures that mix the two baselines exaggerate or understate the drop depending on the author's choice. We stick to PortWatch.
That calm in Brent is the same mispricing we flagged when the market was still priced for peace at $73, only the physical evidence has since hardened.
The split has since widened. Diesel cracks have broken $100 while crude stays relatively calm. See why the crack spread, not Brent, is now the real thermometer.
Why the risk score goes to 84, not 95
Drivers pushing the score higher:
- Ceasefire formally dead
- First crew fatality of this phase
- US blockade reinstated
- Insurance market withdrawing cover
Factors keeping it below a full-crisis reading:
- The US still runs an escorted corridor (~15 Mb/d total Gulf outflow per the Energy Department)
- Diplomatic channels are not fully closed
- Brent futures show no panic bid
Run the new calibration yourself in the Hormuz Risk Monitor & Scenario Simulator.
The question is no longer whether the strait stays contested, but whether the new IRGC targeting logic, compliance instead of flag, is establishing a de facto Iranian permit regime under the eyes of the US Navy.
For the live Strait of Hormuz picture, see the status page.
For weekend traffic collapse and SPR drawdowns since mid-July, see the Hormuz Update of 11 August.
On how freight markets capture the same disruption, see the tanker investors opportunity analysis.
When a week like this tempts traders to chase the first candle higher, see our analysis of why chasing an oil spike is rarely an edge.
For live market commentary as events unfold, follow us on X (@hormuzeye).
HormuzEye provides market analysis and educational information only. This article is not investment advice. Oil prices and geopolitical risks can change quickly. Verify live market prices before making any decisions.